
5 Real Cases Where Better Data Questions Drove Game Growth

By Elad Levy, Founder of Dive - a data company born from his Playtika exit, bringing enterprise-level analytics to any game studio.
We’ve worked with dozens of game teams on various platforms, including mobile, PC, Roblox, and web, and we've noticed a pattern: When things aren’t working, the data is usually too high-level. That’s because everyone tends to ask the same questions, relying on pretty much the same standard dashboards. Real insights happen when the developers begin asking specific questions.
Asking the right questions leads to specific insights, which in turn help business owners take better actions and drive product growth. Over 90% of the clients we work with have grown tens of thousands, and even hundreds of thousands, of percent in revenue as a result of working smarter with data.
So, how do you ask better questions?
Instead of asking boring questions like “What is my D1 retention?”, try asking:
“What is the economy impact on FTUE (First time user experience)?”
“Are influencers bringing users who stick around?”
“Did this new feature improve retention, conversion, or session length for those who used it?”
“Where exactly do users churn, and why?”
“How long does it take players to reach key milestones? In days, sessions, or total time?”
This piece is a collection of real moments we’ve seen with our clients, places where someone looked closer, asked the right question, and the needle finally moved.
1. The Game Economy Trap
One lifestyle mobile game team came to us with a classic problem: players weren’t sticking, and revenue was stagnant. The data showed that the economy was pretty balanced on a daily average. On some days, it had a net positive, meaning players were gaining more currency than spending in the game, and on some days, the net was negative. There were no extreme trend spikes either way.
But when we split the data by player seniority, it clicked:
New players (seniority 0) had a negative net economic flow. Meaning, they were spending more currency than they obtained in the game on average. Not enough freebies, too many sinks that leave new players without currency to play with. That frustration can lead to early churn.
Older players (seniority 15-30) had a positive net economic flow. Meaning, they were getting more currency than they spent on average. These are players who love the game and sit on piles of currency with nothing to spend it on. They only had one sink.

What the studio changed:
Boosted early-game rewards to avoid punishing onboarding, plus reduced effort level.
Added late-game currency sinks for hoarding veterans, including special offers and features that open at higher levels.
The studio personalized the economy experience for new and older players. Different user segments require different game experiences.
In the month following the change:
D1 retention increased from 37% to 41%, a 4% increase
D7 increased from 12% to 15.4%, a 3.4% increase
D30 increased from 3.3% to 5.2%, a 1.9%increase
D60 increased from 2.2% to 2.7%, a 0.5% increase
Although D1 is not the only indicator of a game’s success, it is a critical metric to optimize before investing in user acquisition (UA). For this studio stage, it was important to increase D1 so they could show investors that their UA money would not go to waste.
2. The 1% Dip That Broke Revenue
At one huge social casino game, we saw a tiny dip in the loading funnel, just a 1% drop in users making it into the game. But revenue took a disproportionate hit.
We took three top engineers and added 30+ tracking events to break down every step: We analyzed everything: how assets were loading, how users were connecting to the game server, how the user ID was being fetched, and the performance of various CDN calls.
We found nothing. No obvious bottlenecks, no consistent failures.
So we worked directly with the support team. We found an active player who just experienced a crash and offered a big coin gift in exchange for letting us observe their session live.
That’s when we found it: a rare JavaScript bug stalling the loading process.
We pulled an all-nighter to patch the bug and ship a new build, and it was worth it. Within hours, we saw the numbers bounce back. Revenue lifted, and marketing effectiveness improved.
What looked like a minor 1% drop had actually been a silent blocker, quietly draining value. Fixing it made a measurable, immediate impact.
3. Creators Who Look Good, But Are Bad at Converting
We helped a large Roblox game developer evaluate its influencer strategy. At first glance, we identified three top creators by the revenue their campaign generated for the studio. Creator “A” was driving the most revenue. Win, right?
Right, until we sliced creators' revenue by player seniority and by First Time Depositors (FTDs). We looked at new users against older users.
For new users, we looked at users who installed the game today. We call this segment “seniority 0”. For older users, we looked at players with seniority 15-30: users who installed the app between 15 to 30 days ago.
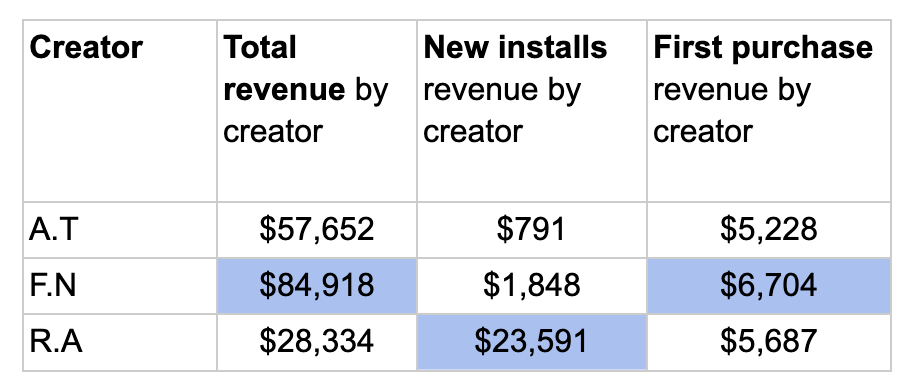
We found that the revenue generated from creator A.T. was mostly coming from returning users, not new ones. However, a smaller revenue-making creator, R.A, was bringing a much higher % of new users out of her revenue generated, and had a higher % of players converting to FTDs out of her revenue.
The studio used the insight to adjust marketing messaging per creator, targeting new users differently vs. returning users. The key takeaway: not all creators are equal, and “total revenue” doesn’t tell the full story. During that period, the studio saw a 150% increase in ARPPU while optimizing both their influencer strategy and running multiple pricing and feature experiments.
4. First Session Behaviour That Doesn’t Make Sense
Sometimes, you find gold in the first session experience. Think of the first session experience as part of your onboarding. Players need to get hooked to your game in the first few minutes. If they have a bad experience for any reason, they’ll churn.
One of our social casino card game clients had a D1 of 22%. We thought this might be due to the first match result (win/loss). We saw that the majority of the first sessions were either not completed or finished with a loss for the player. So we developed a hypothesis that many users don’t know how to play the game.
To test this theory, we classified player sessions into four groups based on early gameplay behavior. We used an exploratory data analysis approach based on the assumption that players familiar with the game would make logical first moves. So, we defined some basic logical moves a player would make if they understand the game mechanics.
This wasn’t a full-scale analysis, but a quick way to test if player experience level was influencing retention.
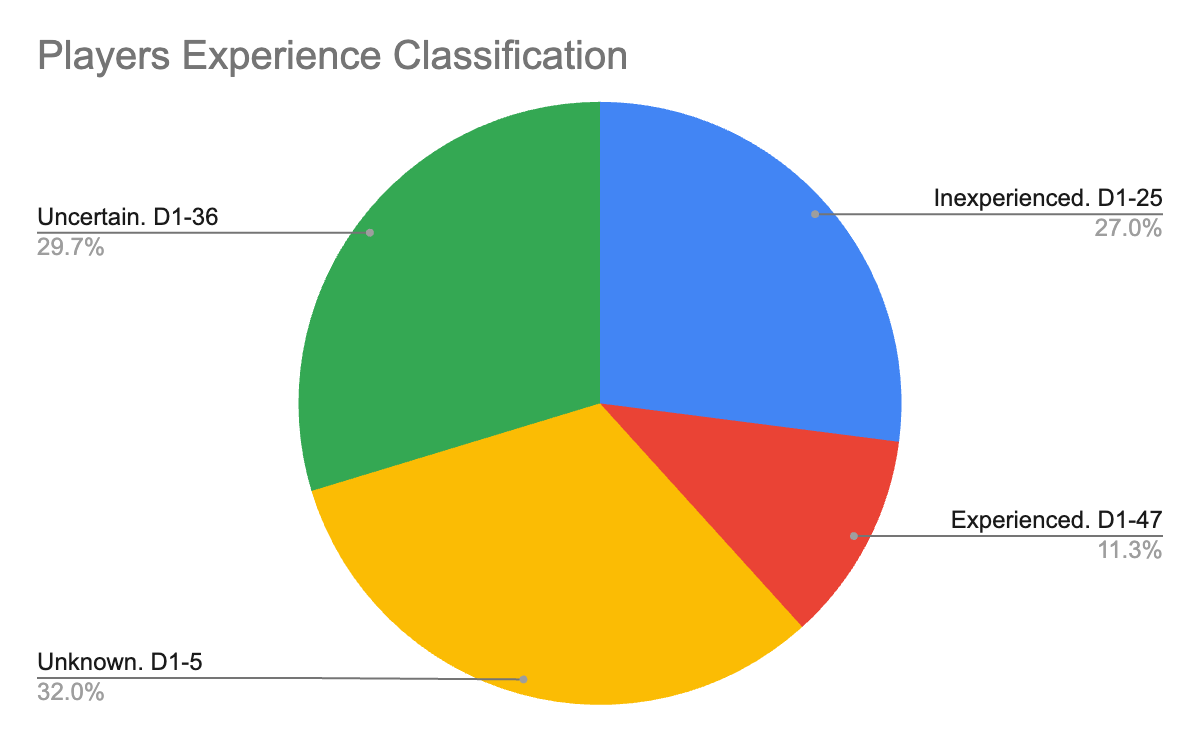
Likely inexperienced players: players with unstable bets, not using strategic moves. These players made up about ⅓ of the audience, with a D1 retention of 25%.
Likely experienced players: players with stable bets, using strategic moves. These were around 11% of users, and their D1 was 47%.
Players who churned before we could classify them also accounted for about ⅓, with a very low D1 of 5%.
The remaining 19% were “uncertain”. Their behavior couldn't be clearly defined as experienced or inexperienced. This group had a D1 of 36%.
The studio is planning to improve FTUE with a "fork" that asks people if they know how to play and then presents inexperienced players with a detailed tutorial.
There’s a lot more to investigate here, such as where we can find more of these experienced players, what marketing channel or creative brings them? What's their ROAS? These questions are easy to look at once the experience groups are identified. It’s easy to get lost in investigating multiple directions. We like to be super focused when we start our analysis, and here, the question was - do players drop because they don’t know how to play? We’ve identified a clear opportunity: a significant group with high D1. Now, the next step is to work on ways to multiply this group.
5. Tying Pricing to Player Behavior
Every studio struggles with in-game offers. We’ve heard it all:
“Should we show a $4.99 offer or $9.99 offer? How often should we present a special offer?”
There’s no universal answer, but there is a better way to ask the questions. First, you need to know your player's behavior:
How many of your players are Grinders vs. Spenders? Cosmetics buyers? Discount hunters? Potential VIPs?
What is your deposit habit scale?
What is the player's wallet balance?
What is their “hangover” behaviour?
With that in place, pricing and timing become data-driven, not guesswork.
One of our skill games clients increased their ARPDAU 18x, going from $0.10 to $1.90 within a year. They did it by implementing a smart offers plan with more than 700 active segments, carefully personalized by players' behavior. Most studios choose to cut down segments to a minimum so that they can have a good grasp on what’s happening. This specific studio asked us to manage multiple segments and micro-segments so they can get very specific about the experience they present to players.
Segments focused on deposit habits, tutorial journeys, dormant users communications and offers, VIP segments, payer Vs non-payer, countries, platforms, and even feature completion progress (as an example: selling a “complete feature” offer to players who have about 90% meta feature competition rate).
But fear not, you do not need to have 700 segments to succeed. This is an advanced way to monetize. Most studios can boost revenue with a small number of segments, and sometimes you only need one good offer to boost your revenue.
As an example, one lifestyle mobile game implemented a “Rolling Offer”, which is an offer meant to increase ARPDAU. At first, it seemed like the offer was a success; more people were buying, and they saw a boost in revenue, but quickly the studio realized that the offer was bringing the deposit habit down. The action the studio took after that was to optimize the price points per deposit habit.
The result: the offer drove a 40% increase in overall revenue from November 2024 to date, consistently adding ~40% to monthly revenue.
What mattered:
In every case we’ve shared, the breakthrough didn’t come from more dashboards or more data; it came from asking better questions. From challenging assumptions. From zooming in instead of zooming out. The difference between teams that grow and teams that plateau isn’t access to data; it’s how they use it.
Great teams treat data not as a mirror, but as a microscope. If you allow me just a little bit of self-promotion, at Dive, our mission is to help you build that habit, not just by providing tools, but by helping you develop the muscle of inquiry. Because when you know where to look, even small changes can move the needle in big ways.
To summarize it all, if there’s one theme I’ve seen, it’s this: when game teams stop treating data like a dashboard and start treating it like an investigation. That’s when things change.
About the author:
Elad Levy scaled his previous social casino game to a $1B valuation and a successful exit to Playtika — all by using data to drive growth. With those insights, he founded Dive: a data platform purpose-built for cross-platform games and playable apps. Dive powers A/B testing, analytics, and optimization — without the need for a full data team.