
5 Numbers Hiding in Plain Sight: Sensor Tower's Ad Monetization Report
Written by Josh Chandley, President and COO at WildCard Games, where he runs product, production, and marketing for a portfolio of ad-monetized games. He has spent the past decade working out ad monetization one live game at a time: eCPM floors, mediation waterfalls, and network economics.
Sensor Tower published the first ad monetization estimates in the company's history this month. $12 billion. 2.4 trillion impressions. 19 countries. The revenue number will get quoted everywhere.
I spent half an hour with Sensor Tower’s Lead Analyst, Sam Aune, working through the charts. Five surprising numbers came out of it. Some are buried in the body copy. Some you only get by dividing two of Sensor Tower's own figures together. Most importantly, none of them are on the summary slide.
Listen to the full conversation with Sam Aune
Hidden Fact 1: $12B isn’t the size of the ad market. It’s the floor number.
Sensor Tower estimates that mobile games generated $12 billion from ads in 2025. The natural response is to store that as the size of the market. That misses what the number actually is.
I asked Sam whether the nineteen countries were the largest nineteen by revenue, or the nineteen that were easiest to count. "These are just the nineteen countries that we felt comfortable having estimates for," he said. "That we feel like our panel is good enough and covers ads well enough." That is a statement about measurement confidence, not about where the market ends.
Here is the scale of what sits outside the window. Sam's numbers put roughly one third of IAP revenue in geos this report does not cover. Scale $12 billion by that same third and you land at $18 billion. I would not rely on that method, because ad revenue and IAP do not distribute the same way across countries. Developing markets skew toward ads and developed markets skew toward purchases, so the geos holding a third of IAP almost certainly hold a different share of ad revenue.
A better way to check it is against what operators see. I buy and sell ad inventory in this market. My sense is $16 to $20 billion for 2025.
I asked Sam directly whether to file the $12 billion as an estimate or as a floor. "The floor analogy works best," he said. Take him at his word, because every number downstream of it inherits the same undercount: market share, take rates, genre splits, all of them. That does not make the report useless. It makes it the best directional read the industry has had on ad monetization, and it means every figure in it should be read as at least this big.
For publishers, the practical consequence is that your own ad revenue is a larger share of a larger market than this report shows. If you have been sizing the ad opportunity off public estimates, you have been sizing it low.
Hidden Fact 2: Ads are 23% of net mobile game revenues
The first thing I do with a new number is find something to compare it against. Sensor Tower's own State of Mobile put 2025 IAP at $81.8 billion in gross revenue. After store fees it is roughly $60 billion net, which puts ads at about 17% of mobile game revenue.
That math is wrong, and it is wrong in a specific way. The $60 billion is global. The $12 billion covers nineteen countries. Comparing them is comparing a salary to a take-home. Sam ran the correction live. Restrict IAP to the same nineteen markets, and you get roughly $40 billion net. Against $12 billion in ads, that is 23%.
He then immediately talked his own number back down, for the reason in Fact 1. The nineteen may over-index on ad-heavy markets. 23% is the share inside the measured window, not the global share, and the global share is lower. There is also a slice very few can count yet. Sensor Tower launched US web store estimates in June and puts H1 2026 US direct-to-consumer at $2.3 billion. Fold that in, and the US splits roughly 73/14/13 across IAP, web store, and ads.
So the honest picture is a range, not a figure. Thirteen percent in the US with D2C included. Twenty-three percent across the nineteen.
Thirteen to twenty-three percent of net revenues is a large enough share that advertising cannot be treated as a side system attached to the “real” mobile game economy. It is one of the market's primary revenue engines. And according to Redseer Research, games’ in-app ad revenues have been growing 16% year-over-year since 2020 while in-app purchases have grown around 3% annually. Studios that manage only the purchase economy or only the ad economy are optimizing one side of the business.
Hidden Fact 3: Gaming Advertisers No Longer Own Gaming Inventory
Five years ago, it felt like only games bought ads in games. That era is definitively over.
Across every game genre in Sensor Tower’s report, non-gaming advertisers now account for 30% - 50% of impressions. But non-gaming advertisers generate only 28% of ad revenue.
That gap suggests they are paying lower CPMs on average than gaming advertisers. The report does not fully explain why, but format mix is one likely cause. Rewarded Videos can have 30-100x higher prices per impression.
A year or two ago at WildCard, our number one advertiser by impressions was Walmart.
That initially looked strange because we were still thinking about in-game advertising as an app-install marketplace. It was not. We had meaningful banner inventory, and Walmart could buy enormous volume without needing a playable, a gameplay video, or a $10 install to make the economics work.
The mistake we made was treating advertiser category as the main signal when, in fact, format was controlling the result. High volume. Lower CPM. Still meaningful revenue.
Sensor Tower's non-gaming category includes e-commerce, finance, utilities, social platforms, AI products, and other consumer apps. Temu wants customers. Rocket Money wants subscribers. ChatGPT wants users. Sam believes the dataset covers app install ads specifically, not web or brand campaigns, so these are performance buyers running the same objective function you are. They have entered gaming because mobile games aggregate large, commercially valuable audiences.
For a publisher today, that is incremental yield. Non-gaming demand is filling placements your gaming competitors were never going to buy, at prices that clear inventory which would otherwise go unsold.
Hidden Fact 4: IAP-first beats IAA-first, but so does IAA-pure.
First, definitions.
Hybridcasual: a relatively simple game in production values and depth that monetizes aggressively through both in-app ads and microtransactions. Archero, for example.
IAP-first: hybridcasual games with the majority of revenue (+70%) coming from microtransactions. Magic Sort, for example.
IAA-first: hybridcasual games with the majority of revenue (+70%) coming from ads. Hexa Sort, for example.
IAA-pure: games that monetize entirely through ads, with no meaningful purchase economy. Block Blast, for example.
Sensor Tower’s hybrid data appears to deliver a clear verdict. The largest IAP-first hybrid games are generating roughly 4x the revenue of the largest IAA-first hybrid games. Read on its own, that makes IAP-first look like the winning model and ads look like the weaker engine. The conclusion does not survive contact with the IAA-pure cohort.
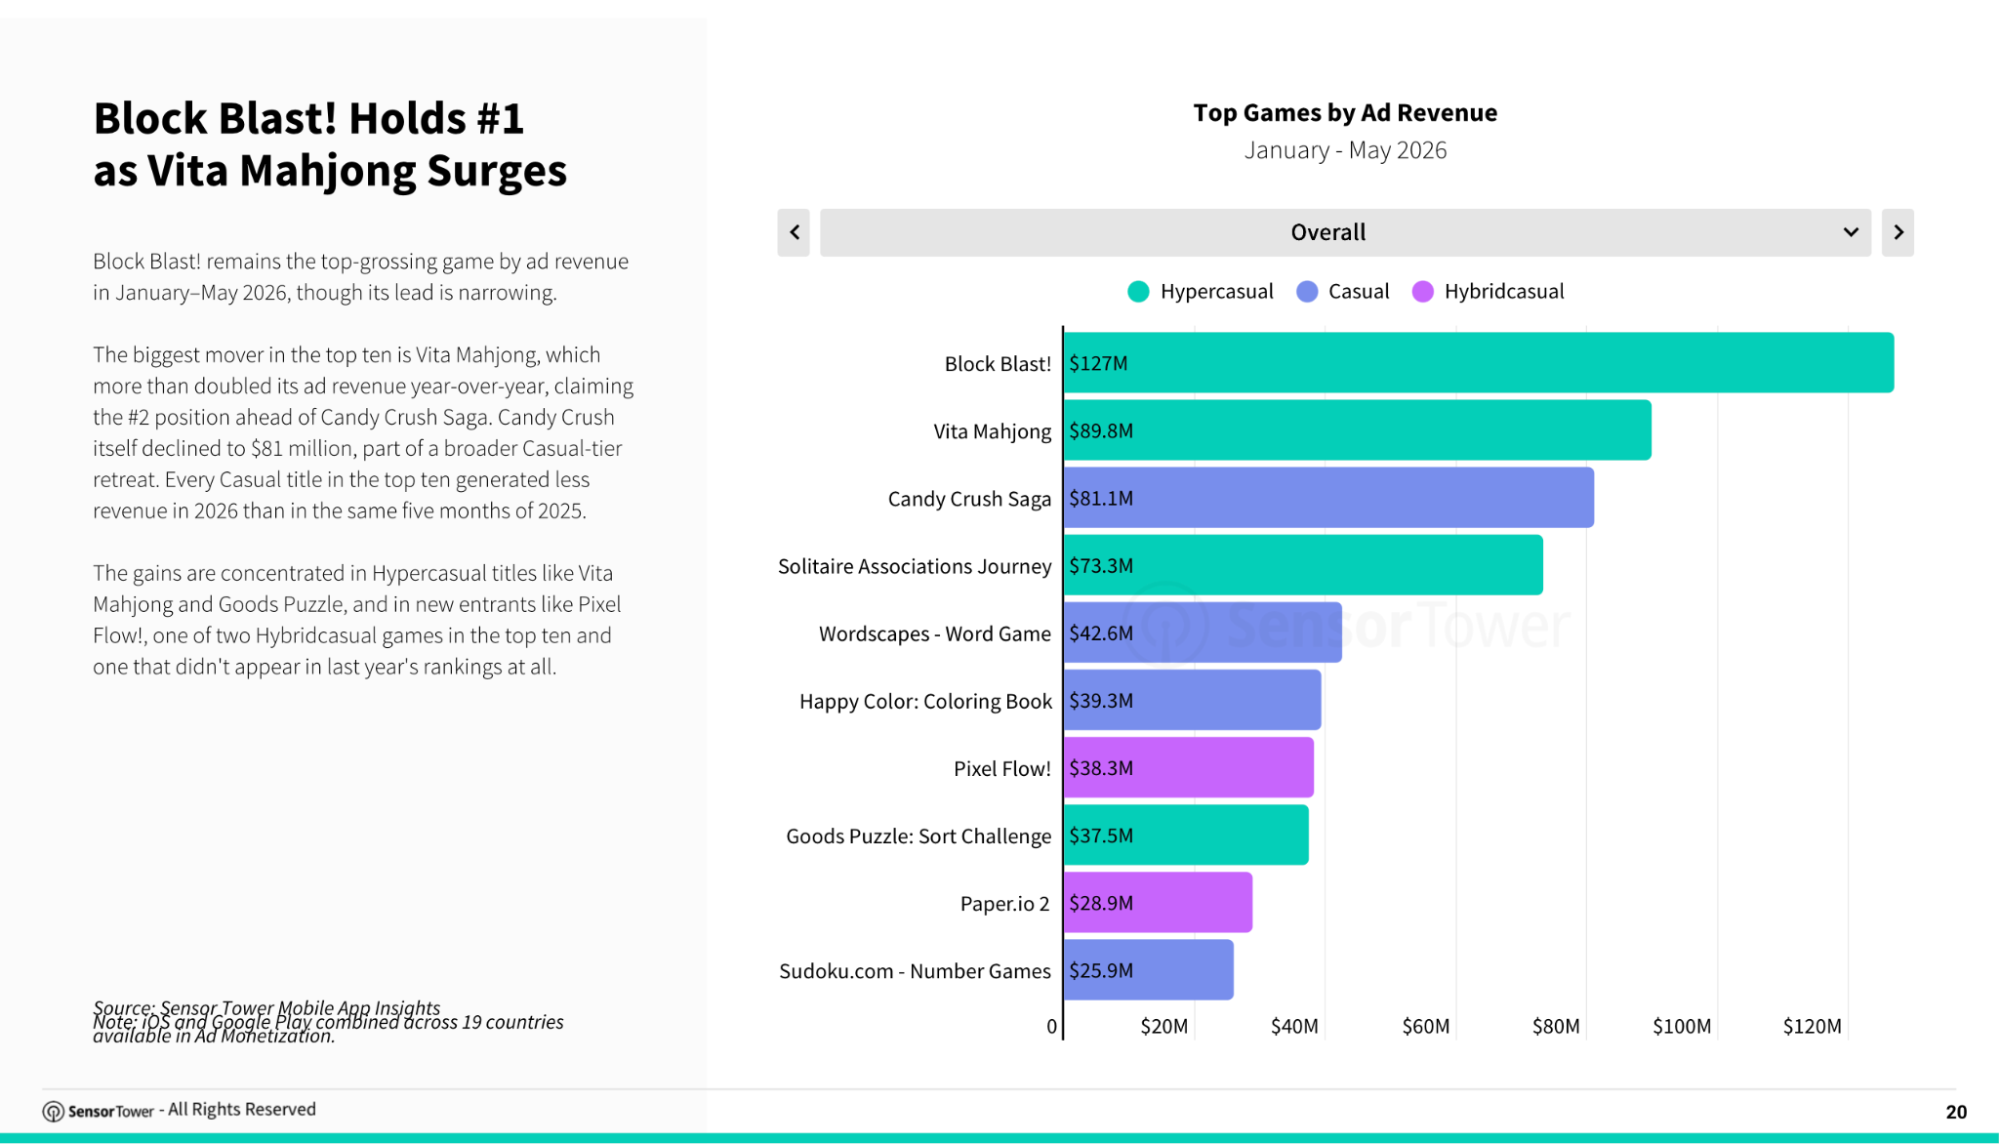
Block Blast generated an estimated $127 million in ad revenue so far in 2026 within Sensor Tower's covered markets. Vita Mahjong was at approximately $90 million. Solitaire Associations Journey was at approximately $73 million. That is net revenue, since platforms only take their pound of flesh from microtransactions. These are not small businesses running on a weak model.
Three of the top five ad-focused games in Sensor Tower's chart show no visible IAP revenue, and their note puts IAP as low as 3 percent for titles in this cohort. Most studio heads would not call a game earning 97 percent of its revenue from ads a hybridcasual game. Filtering out titles that are effectively IAA-pure, the IAA-first cohort looks emptier than expected.
The more useful question is not which model earns the most. It is which model has a clear hierarchy. IAA-pure games have one objective function: maximize valuable attention without breaking retention. IAP-first games have a clean order of operations: protect the purchase economy, then add ads to monetize the players who are not buying. IAA-first games have no default. Two monetization loops compete for the same session, and few teams have found a rule for which one wins.
The migration out of hypercasual was not a verdict on ad monetization. It was a response to a price collapse. Tenjin measured iOS eCPMs down 35 percent across 2022 and Android down 28 percent as ATT dismantled targeting. Once ad prices fell and UA costs continued to grind upwards, studios needed an IAP component to their games to keep up. Prices have since recovered, bringing back more opportunities to monetize attention.
For publishers, the practical move is to stop reading these cohorts as categories and start reading them as revenue mixes. If your game earns most of its money from attention, run it that way and stop treating the store as a growth lever you are obligated to pull. If it earns most of its money from purchases, ads are your non-payer monetization and likely nothing more. The games in trouble are the ones that never decided.
Hidden Fact 5: The Biggest Market Opportunity
I asked Sam twice: what would he build?
First on genre. Puzzle, "the reddest of oceans," and still where he would start, because new mechanics keep breaking out of it. Pixel Flow! entered from zero and did $38 million in ad revenue alone through May.
Second, on model. IAP-focused hybrid, because that is where he sees the breakouts landing.
I understand the answer. It is the safer strategy, it is where the strongest recent breakouts have appeared, and it combines whale monetization with incremental ad revenue. For exactly that reason, I do not think it is the biggest opportunity.
The biggest opportunity is IAA-first hybrid done correctly. IAA-pure games prove that attention-first products can generate nine-figure revenue. IAP-first hybrids prove that ads and purchases can coexist. Today’s IAA-first hybrids prove that bolting a store onto an ad-driven game does not work. The reason it does not work is more specific than most people assume.
In a game that monetizes attention, the store's best product is already free.
Think about what a player actually buys in a casual game. A continue after a fail. A booster. Those are two of the biggest sellers in the category, and they are also two of the biggest rewarded video placements. The store and the ad unit are selling the same product, one for money and one for thirty seconds of attention. Either your price collapses or you make the rewarded reward worse, which pinches the engine that is actually paying the bills.
The obvious workaround is a catalog that never touches the ad loop. Cosmetics, themes, content packs, status goods. That is solved, and it is also why it is not the answer. In simple games those categories monetize weakly. You avoid the cannibalization by selling something few players want.
So the key challenge for the next year is finding something valuable enough to convert at high price points, without pulling players out of the ad loop that is already paying the bills.
Sensor Tower's first State of Ad Monetization report does not close the book on mobile game advertising. It finally opens it.
Everything in it is a floor. Which means ad monetization is still more attractive than it looks.
The rest is in the interview.
